The Super Bowl Ticket Effect and the Fed Threading the Needle
In 1967 you could buy a ticket to the Super Bowl for $10. In inflation-adjusted terms, that equates to about $93 today. Yet Super Bowl tickets this year averaged an incredible $8,837 and the cheapest tickets went for $3,480. On the other hand, the price of a 20” Zenith color television set in 1967 was $469.95. Inflation adjusted, that’s $4,234 today. For $470 you can now walk out of a Walmart with a 65” smart television. In general, over the long term goods prices tend to increase at a lower rate than inflation (while increasing in quality) while services (the Super Bowl is entertainment) have generally seen prices rise much more rapidly.
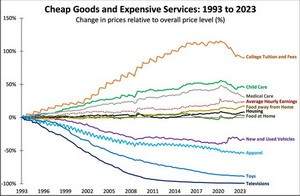
Source: Bureau of Labor Statistics
A counterintuitive insight is that Super Bowl ticket prices have soared largely because the prices of goods like television sets have fallen dramatically in real terms. The reason is what’s known as the Baumol Effect. You can separate goods and services into those where labor productivity increases significantly over time like manufactured goods, technology, and agriculture vs. those where it doesn’t like haircuts, childcare, and Super Bowls. The industries where labor productivity grows, naturally see rising wages (more productive labor generates more income). These gains, however, also force wages higher in industries where productivity isn’t growing. If, for instance, highly productive manufacturing laborers earned ten times as much as those working at a daycare, most daycare workers would quit and seek work in a factory. This forces daycare owners (and the owners of other businesses in less productive industries) to raise their employees’ wages to more competitive levels.
Now, in industries with high productivity growth like the production of TVs, there tends to be more modest inflation (and often deflation) despite soaring wages. A worker may earn five times as much as he used to, but he can produce five times as many TVs in an hour at much higher quality.
Conversely, although daycare workers have seen their wages rise in concert with manufacturing employees, their productivity hasn’t increased at all – they still care for the same number of children as always. But because their wages have risen so much, the cost of childcare soars. This phenomenon is evident across many areas of the economy from healthcare to plumbing to legal advice to college tuition. Any industry reliant on human labor where productivity gains are difficult to achieve tends to experience soaring prices.
In addition to the Baumol Effect, Super Bowl ticket prices have also benefited from a rising population. There were 3.5 billion people on the planet in 1967, and today there are 8 billion. But the number of Super Bowls each year remains just one (more than twice as many people chasing the same number of tickets).
I often think about other places where the Baumol Effect plus a rising population – let’s call it the Super Bowl Ticket Effect – might come into play. As the population grows and gets wealthier, for instance, the supply of Picasso paintings stays the same. Back in the 1970s Picassos typically sold for around $1 million and sometimes less. These days, they often go for more than $100 million. By comparison, a dollar in 1975 only had about 5.7x more purchasing power than a dollar today. Even if inflation is relatively modest going forward, it’s not inconceivable that Picassos might sell for $10 billion 50 years from now.
Another area where you see the Super Bowl Ticket Effect is prime real estate – these include desirable cities like Austin and Denver or beachfront property in places like Vero Beach. Home prices have skyrocketed in these places, which makes sense when you consider that more people with much greater wealth are largely chasing the same number of properties. The amount of buildable land within a reasonable distance of Austin or close to the beach in Florida doesn’t change much over time.
There’s a tendency to see assets and industries impacted by the Baumol Effect and think that overall inflation in the U.S. has been much higher than it actually was. Prices certainly rose substantially over the last half century but not nearly as much as you would think if you were just looking at beachfront real estate or Super Bowl tickets. And this was especially true until, unfortunately, COVID arrived on the scene.
Since COVID, inflation has accelerated dramatically even in many industries where you’d expect productivity improvements to keep a lid on prices. For instance, a dozen eggs cost $1.40 in 2019. Since then, the average price has surged to $3.52. The average price of a new car was $37,000 in 2019. Now it’s $48,000. Post COVID inflation mostly reflects supply chain disruptions due to the pandemic and sustained strong household demand for goods and services thanks to trillions of dollars in Federal Government stimulus (also in response to the economic disruption caused by the pandemic). In effect, supply was hampered while demand remained robust.
The big question for the Federal Reserve is whether we’re now in a new, more inflationary paradigm or if we will soon return to an environment with relatively modest inflation like pre-COVID. The good news is that price increases have already slowed substantially, as the chart below shows.
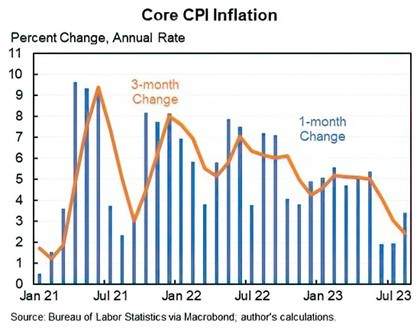
Moreover, the supply chain disruptions caused by COVID have mostly been resolved and the trillions in excess savings amassed by U.S. households thanks to government stimulus have been depleted from $2.1 trillion in 2021 to just $190 billion as of June 2023. With interest rates at 15-year highs further stifling the demand for big-ticket items like homes and autos, my view is that inflationary pressures are likely to continue to abate moving forward.
But even if inflation doesn’t decrease markedly going forward, the Fed will find it difficult to sustain interest rates at current levels. Why? Because if rates remain this high, the Federal budget deficit could potentially spiral out of control. The national debt is currently at $33 trillion. Of that roughly $26 trillion is held by the public while the rest is with other parts of the U.S. government like the Social Security Trust fund. From the Fed’s perspective, the $26 trillion in publicly held debt is what matters because the government pays interest expense on the debt it issues, and that cash goes directly into the U.S. economy with potentially inflationary consequences.
In 2022, there was about $23 trillion in publicly held U.S. debt (average over the entire year). The mean interest rate on that debt was 2.07%. So, the government spent $476 billion in interest. Right now, publicly held debt is around $26 trillion. Worse, as interest rates have risen and the government has rolled over maturing debt, the average interest rate is all the way up to 2.92%. That equates to about $760 billion in annual interest costs.
From 2023-2025, 30%, 12%, and 9%, respectively, of this $26 trillion in debt will mature. If rates stay where they are, the average interest expense on U.S. Government debt is therefore likely to rise substantially, perhaps to 4% and beyond. We also continue to run significant budget deficits, which are projected to be around $1.5 trillion this year and $1.8 trillion next year.
So let’s imagine a scenario where publicly held government debt is $30 trillion with an average interest rate of 4.5%. In that case, the government would be paying out $1.35 trillion in interest expense alone. To put that number into perspective, the U.S. government only collects about $5 trillion a year in tax revenue and spends about $6 trillion even when we exclude interest costs. Add in the interest costs and the budget deficit could easily grow to $2.35 trillion and beyond, an amount that simply isn’t sustainable in a $27 trillion economy.
Now when I say the U.S. government can’t maintain current debt levels with interest rates this high, I don’t mean to imply that there’s any risk of default. The U.S. government’s outstanding debt is issued in a currency – the U.S. dollar – it can print at will. Accordingly, the risk of exploding budget deficits is not default but high inflation.
Thus, we’re presented with the paradox of current Federal Reserve policy. Its goal is to prevent inflation by raising interest rates and slowing economic growth. But if it keeps interest rates too high for too long, the Federal Budget deficit will soar ever higher, which itself could be inflationary as the government prints more and more dollars to pay its debts. The Fed really has to thread the needle here. They must contain current inflation but then quickly pivot to cutting interest rates to keep the budget deficit in check.
Regardless of how successful the Fed is, stocks remain one of the best inflation hedges around, as companies’ revenue (and typically profits) by definition rise with higher prices. Concerning the prospect of higher rates, the financial strength of PASI stocks is robust with debt to total capital averaging just 6.4% vs. 11.4% for the mean S&P 500 company. Moreover, PASI stocks have almost two times as much cash flow as they have debt maturing over the next few years while the average S&P 500 company has just barely enough.